Server Stats
From OpenSimulator
(Difference between revisions)
| Line 87: | Line 87: | ||
</source> | </source> | ||
now find the following bit of code at the bottom: | now find the following bit of code at the bottom: | ||
| − | <source> | + | <source lang="php"> |
// Define what Graphes we want in the detail view (detail.php) | // Define what Graphes we want in the detail view (detail.php) | ||
$config['types'] = array( | $config['types'] = array( | ||
| Line 100: | Line 100: | ||
</source> | </source> | ||
and change it to: | and change it to: | ||
| − | <source> | + | <source lang="php"> |
// Define what Graphes we want in the detail view (detail.php) | // Define what Graphes we want in the detail view (detail.php) | ||
$config['types'] = array( | $config['types'] = array( | ||
| Line 115: | Line 115: | ||
* Edit ./serverstats/config/main.php, and change this code: | * Edit ./serverstats/config/main.php, and change this code: | ||
from: | from: | ||
| − | <source> | + | <source lang="php"> |
'step' => 300 | 'step' => 300 | ||
</source> | </source> | ||
to: | to: | ||
| − | <source> | + | <source lang="php"> |
'step' => 60 | 'step' => 60 | ||
</source> | </source> | ||
Revision as of 22:28, 22 October 2008
Installation steps
- Get Serverstats from Berlios
- Install rddtool (depending on your distro, it should be in the repository. Otherwise download here)
- Get the OpenSim serverstats module:
svn checkout http://forge.opensimulator.org/svn/serverstats
- Copy serverstats to /my/apache/root/serverstats
- Move ./serverstats/config.sample/ to ./serverstats/config/
- Copy the opensim.php module to ./serverstats/config
- Edit ./serverstats/config/sources.php, and add this code:
include "opensim.php";
$config['opensim']['module'] = new opensim();
- Edit ./serverstats/config/graph.php, and add this code:
$config['list'][] = array(
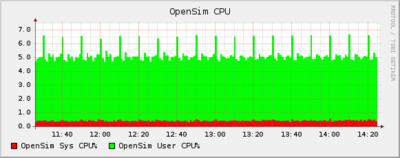
        'title' => 'OpenSim CPU',
        'lowerLimit' => 0,
        'altAutoscaleMax' => true,
        'content' => array(
                array(
                        'type' => 'AREA',
                        'source' => 'opensim',
                        'ds' => 'opensim_cpu_sys',
                        'cf' => 'AVERAGE',
                        'legend' => 'OpenSim Sys CPU%',
                        'color' => 'FF0000',
                ),
                array(
                        'type' => 'AREA',
                        'source' => 'opensim',
                        'ds' => 'opensim_cpu_user',
                        'cf' => 'AVERAGE',
                        'legend' => 'OpenSim User CPU%',
                        'color' => '00FF00',
                        'stacked' => true,
                ),
        )
);

$config['list'][] = array(
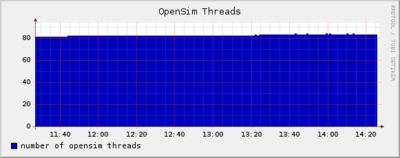
	'title' => 'OpenSim Threads',
	'lowerLimit' => 0,
	'altAutoscaleMax' => true,
	'content' => array(
		array(
		        'type' => 'AREA',
                        'source' => 'opensim',
                        'ds' => 'opensim_threads',
                        'cf' => 'AVERAGE',
                        'legend' => 'number of opensim threads',
                        'color' => '0000BB',
		),
        )
);

$config['list'][] = array(
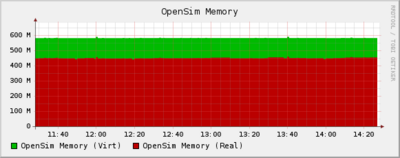
	'title' => 'OpenSim Memory',
        'lowerLimit' => 0,
        'altAutoscaleMax' => true,
	'content' => array(
		array(
			'type' => 'AREA',
                        'source' => 'opensim',
                        'ds' => 'opensim_virt',
                        'cf' => 'AVERAGE',
                        'legend' => 'OpenSim Memory (Virt)',
                        'color' => '00BB00'
                ),
		array(
                        'type' => 'AREA',
                        'source' => 'opensim',
                        'ds' => 'opensim_real',
                        'cf' => 'AVERAGE',
                        'legend' => 'OpenSim Memory (Real)',
                        'color' => 'BB0000'
                ),
        )
);
now find the following bit of code at the bottom:
// Define what Graphes we want in the detail view (detail.php)
$config['types'] = array(
//	array('title' => 'Hour', 'period' => 3600), // only useful if you have a small step
	array('title' => 'Day', 'period' => 86400),
	array('title' => 'Week', 'period' => 604800),
	array('title' => 'Month', 'period' => 2678400),
	array('title' => 'Year', 'period' => 31536000)
);
// The period uses in the graph overview (index.php)
$config['defaultperiod'] = 86400;
and change it to:
// Define what Graphes we want in the detail view (detail.php)
$config['types'] = array(
	array('title' => 'Hour', 'period' => 3600), // only useful if you have a small step
	array('title' => 'Day', 'period' => 86400),
	array('title' => 'Week', 'period' => 604800),
	array('title' => 'Month', 'period' => 2678400),
	array('title' => 'Year', 'period' => 31536000)
);
// The period uses in the graph overview (index.php)
$config['defaultperiod'] = 10800;
- Edit ./serverstats/config/main.php, and change this code:
from:
'step' => 300
to:
'step' => 60
- Make sure you allow php to access /proc . Edit php.ini and set open_basedir = ..:/proc
- Add a crontab with 'crontab -e', and enter a cronjob for update.php:
* * * * * php /my/apache/root/serverstats/update.php
- Check out if the script executes the way it's supposed to be, by running it from the shell.
php update.php
Done! Now check out if the graphs are generated, by pointing your browser to the serverstats directory. You'll see some nice stats if everything went right.


